Services offered by The Map Consultancy
Maps appear in





Interactive maps
⚲ Turn your data into exploratory, mobile-friendly maps
⚲ Custom interactive graphics with your branding and colors
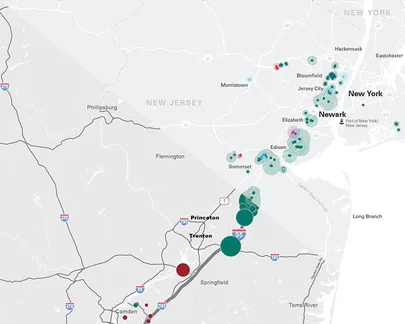
2020 vehicle fatality rates for U.S. cities
Change in vehicle accident death rate per 100k residents from 2010 to 2020:
■ -25% to 0% ■ 0% to +25% ■ +25% and above
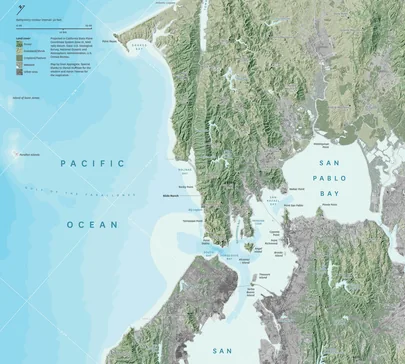
Custom map design
⚲ Award-winning maps have appeared in National Geographic, Bloomberg Businessweek
⚲ Reference and terrain maps with your branding and colors
⚲ Maps for your interiors, team gifts
Data visualization & infographics
⚲ Thematic graphics for your reports, decks, and campaigns
⚲ Attractive charts that match your branding

Geospatial analysis
⚲ Spatial data analysis & integration
⚲ Consumer, commuter and travel pattern maps
⚲ Demographics and location analysis
Map style guides & training
⚲ Style guides tailored to your branding and workflow
⚲ Remote and in-person training for your design teams: map self sufficiency in 3 months
Data services & research
⚲ We find the data for you to make your own maps, you receive it in your choice of database
The Process

Discover
Within a few emails we’ll find what your maps need to say. You hand off the data.

Design
We work within your design language to make maps for your walls, slides, reports, collateral, events & campaigns.

Deliver
Whether your deadline is in three hours or three quarters, you receive a well-documented collection of maps and original data.